R Tutorials
R Introduction
R Syntax
R Comments
R Variables
R DataTypes
R Numbers
R Math
R Strings
R If..else
R Operators
R While Loop
R For Loop
R Data Structures
R Vectors
R Lists
R Matrices
R data Frames
R factors
R Graphics
R Plot
R line
R Scatterplot
R Pie Charts
R Bars
R Statistics
R Statistics Intro
R Data Set
R Max and Min
R Mean Median Mode
R Percentiles
R Examples
R Compiler
 Previous
R Line
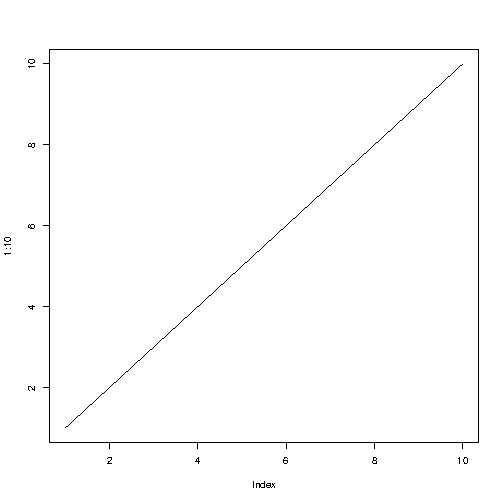
Line Graphs
A line graph has a line that connects all the points in a drawing.
To create a line, use the plot() function and add the parameter type with the value "l":
Example
Result
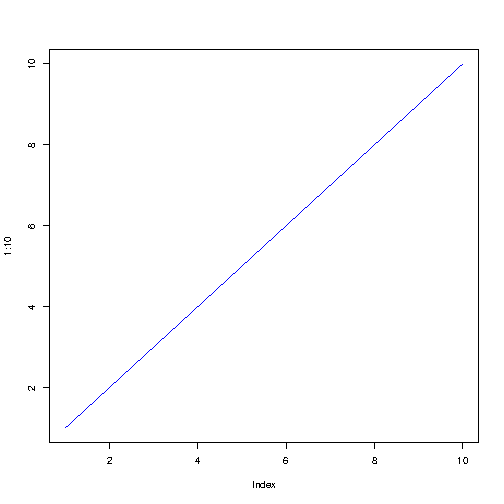
Line Color
The line color is automatically black. To change the color, use the col parameter:
Example
Result
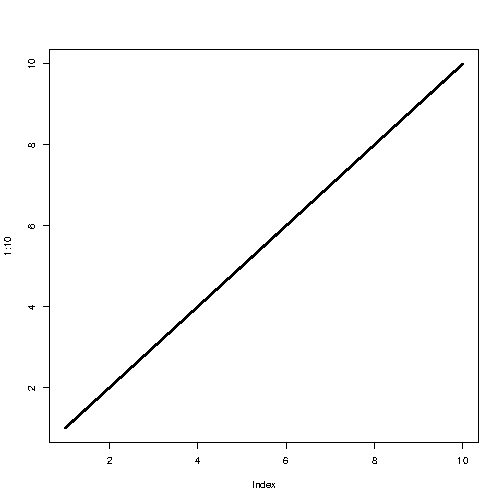
Line Width
To change the line width, use the lwd parameter (1 is wrong, while 0.5 means 50% less, and 2 means 100% greater):
Example
Result
Line Styles
The line is automatically solid. Use the lty parameter with a value from 0 to 6 to specify a line format.
For example, lty = 3 will display a dotted line instead of a solid line:
Example
Result
Available parameter values for lty
0removes the line1displays a solid line2displays a dashed line3displays a dotted line4displays a "dot dashed" line5displays a "long dashed" line6displays a "two dashed" line
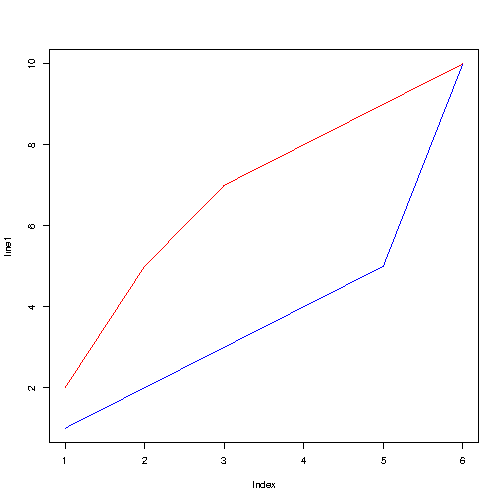
Multiple Lines
To display more than one line in a graph, use the plot() function and the function of the lines():
Example
line2 <- c(2,5,7,8,9,10)
plot(line1, type = "l", col = "blue")
lines(line2, type="l", col = "red")
Result