 Previous
Machine Learning - Decision Tree
Decision Tree
In this chapter we will show you how to make a "Decision Tree". Decision Tree is a Flow chart, and can help you make decisions based on past experience.
For example, one would try to decide whether to go to a comedy show or not.
Luckily our role model has always subscribed to a comedy show in town, and registered some information about the comedian, and whether or not he or she has.
| Age | Experience | Rank | Nationality | Go |
| 36 | 10 | 9 | UK | NO |
| 42 | 12 | 4 | USA | NO |
| 23 | 4 | 6 | N | NO |
| 52 | 4 | 4 | USA | NO |
| 43 | 21 | 8 | USA | YES |
| 44 | 14 | 5 | UK | NO |
| 66 | 3 | 7 | N | YES |
| 35 | 14 | 9 | UK | YES |
| 52 | 13 | 7 | N | YES |
| 35 | 5 | 9 | N | YES |
| 24 | 3 | 5 | USA | NO |
| 18 | 3 | 7 | UK | YES |
| 45 | 9 | 9 | UK | YES |
Now, based on this data set, Python can create a decision tree that can be used to determine whether new shows should be visited.
How Does it Work?
First, import the modules you need, and read the data set per head:
Example
Read and print the data set:
import pandas
from sklearn import tree
import pydotplus
from
sklearn.tree import DecisionTreeClassifier
import matplotlib.pyplot as plt
import matplotlib.image as pltimg
df = pandas.read_csv("shows.csv")
print(df)
To make a decision tree, all data must be numeric.
We must convert non-numerical columns 'Nationalism' and 'Go' into numerical values.
Pandas has a map() method that takes a dictionary that has knowledge of how to convert values.
{'UK': 0, 'USA': 1, 'N': 2}
It means to change the values 'UK' to 0, 'USA' to 1, and 'N' to 2.
Example
Change string values into numerical values:
d = {'UK': 0,
'USA': 1, 'N': 2}
df['Nationality'] = df['Nationality'].map(d)
d =
{'YES': 1, 'NO': 0}
df['Go'] = df['Go'].map(d)
print(df)
Then we have to separate the feature columns from the target column.
The feature columns are the columns we are trying to predict, and the target column is the value column we are trying to predict.
Example
X is the feature columns, y is the target column:
features = ['Age', 'Experience', 'Rank', 'Nationality']
X = df[features]
y = df['Go']
print(X)
print(y)
We can now create a real decision tree, add it to our profile, and save the .png file to a computer:
Example
Create a Decision Tree, save it as an image, and show the image:
dtree = DecisionTreeClassifier()
dtree = dtree.fit(X, y)
data =
tree.export_graphviz(dtree, out_file=None, feature_names=features)
graph =
pydotplus.graph_from_dot_data(data)
graph.write_png('mydecisiontree.png')
img=pltimg.imread('mydecisiontree.png')
imgplot = plt.imshow(img)
plt.show()
Result Explained
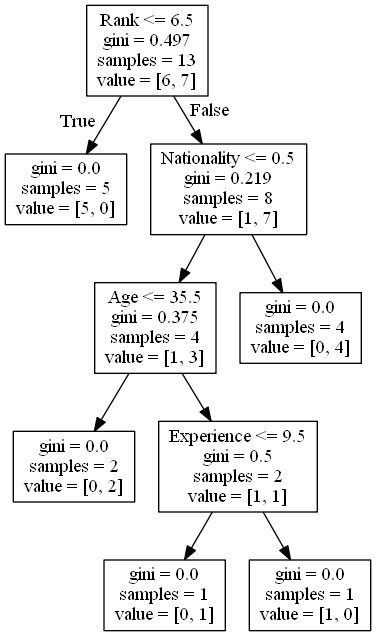
The Decision Tree uses your previous decisions to determine whether you want to see a comedian or not.
Let's learn about the different aspects of the decision tree:
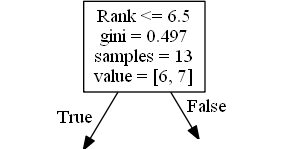
Rank
Rank <= 6.5 means that every comedian with a level of 6.5 or lower will follow the True arrow (left), and everyone else will follow the False arrow (right).
gini = 0.497 refers to the quality of the separation, and remains the number between 0.0 and 0.5, where 0.0 does not mean that all samples get the same result, and 0.5 will mean that the separation is done in the middle.
samples = 13 means that there are 13 comedians left at this point in the decision, which is all as this is the first step.
value = [6, 7] means that of these 13 comedians, 6 will receive "NO", and 7 will receive "GO".
Gini
There are many ways to separate samples, using the GINI method in this study.
The Gini method uses this formula:
Gini = 1 - (x / n) 2 - (y / n) 2
When x is the positive answer number ("GO"), n is the sample number, and y is the negative answer number ("NO"), which gives us the following number:
1 - (7/13) 2 - (6/13) 2 = 0.497
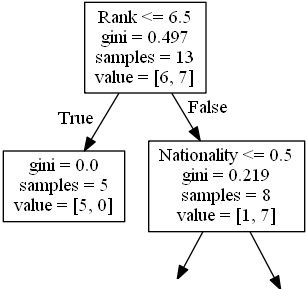
The next step consists of two boxes, one comic box with a 'Rank' of 6.5 or less, and one box with the others.
True - 5 Comedians End Here:
gini = 0.0 means that all samples received the same result.
samples = 5 means there are 5 comedians left in the branch (5 comedians with a rating of 6.5 or less).
value = [5, 0] means 5 will get "NO" and 0 will get "GO".
False - 8 Comedians Continue:
Nationality
Nationality <= 0.5 means comedians with a national value of less than 0.5 will follow the left arrow (meaning everyone from the UK,), and everyone else will follow the right arrow.
gini = 0.219 means that approximately 22 percent of the samples will go in one direction.
samples = 8 means there are 8 comedians left in the branch (8 comedians with a position of more than 6.5).
value = [1, 7] means that of these 8 comedians, 1 will get "NO" and 7 will get "GO".
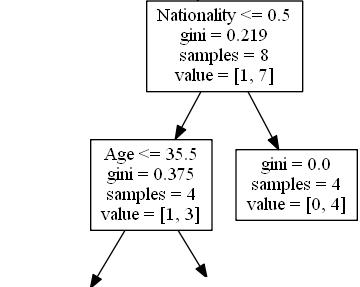
True - 4 Comedians Continue:
Age
Age <= 35.5 means comedians aged 35.5 or younger will follow the left arrow, and everyone else will follow the right arrow.
gini = 0.375 means that approximately 37.5% of the samples will go in one direction.
samples = 4 means there are 4 comedians left at the branch (4 UK comedians).
value = [1, 3] means that out of these 4 comedians, 1 will get "NO" and 3 will get "GO".
False - 4 Comedians End Here:
gini = 0.0 means that all samples received the same result.
samples = 4 means there are 4 comedians left in the branch (4 non-UK comedians).
value = [0, 4] means that out of these 4 comedians, 0 will get "NO" and 4 will get "GO".
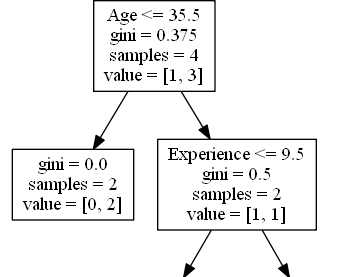
True - 2 Comedians End Here:
gini = 0.0 means that all samples received the same result.
samples = 2 means there are 2 comedians left in the branch (2 comedians aged 35.5 or younger).
value = [0, 2] means that for these two comedians, 0 will get "NO" and 2 will get "GO".
False - 2 Comedians Continue:
Experience
Experience <= 9.5 means that comedians with 9.5 years of experience, or less, will follow the left arrow, and everyone else will follow the right arrow.
gini = 0.5 means that 50% of the samples will go in the same direction.
samples = 2 means there are 2 comedians left in the branch (2 comedians older than 35.5).
value = [1, 1] means that of these two comedians, 1 will get "NO" and 1 will get "GO".
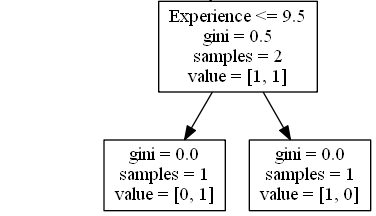
True - 1 Comedian Ends Here:
gini = 0.0 means that all samples received the same result.
samples = 1 means there are 1 comedian left in the branch (1 comedian aged 9.5 or younger).
value = [0, 1] means 0 will get "NO" and 1 will get "GO".
False - 1 Comedian Ends Here:
gini = 0.0 means that all samples received the same result.
samples = 1 means there are 1 comedian left in the branch (1 comedian with more than 9.5 years of experience).
value = [1, 0] means 1 will get "NO" and 0 will get "GO".
Predict Values
We can use Decision Tree to predict new values.
Example: Should I go see a program that features a 40-year-old American comedian, with 10 years of experience, and a 7th comedy level?
Example
Use predict() method to predict new values:
print(dtree.predict([[40, 10, 7, 1]]))
Example
What would the answer be if the comedy rank was 6?
print(dtree.predict([[40, 10, 6, 1]]))
Different Results
You will find that the Decision Tree gives you different results if you use it often, even if you supply it with the same data.
That is because the Decision Tree does not give us a 100% sure answer. It is based on the probability of the outcome, and the response will vary.